For the BIRT project’s Indigo release in June of this year, our plan continues to be to match the BIRT version number with the Eclipse Platform version number used for Indigo. Going forward, this will make it easier for everyone to remember which version of BIRT is designed to work with which version of the Platform. And with Indigo being the 8th major release of the BIRT project, there is no downside with updating the release number to match the Platform release.
At the outset of the Indigo project, it was an open question whether Indigo would be Eclipse 3.7 or 4.0 – so as a short term measure, we adopted BIRT 4.0 as the working release number for BIRT Indigo. Now that the Indigo release will be designated Eclipse 3.7, we plan to update BIRT Indigo to use the BIRT 3.7 designation.
Thursday, January 27, 2011
Changing Eclipse BIRT Indigo Version Number to BIRT 3.7
Posted by
Jason Weathersby
at
8:52 AM
2
comments
![]()
Friday, January 14, 2011
Building BIRT Based Dashboards
If you are using Actuate’s iServer technology, one of the new features for version 11 is the ability to build dashboards using nothing but the browser. These dashboards can be constructed using open source BIRT reports, portions of a BIRT report, Flash Objects, Google Gadgets, and other web content. Completed dashboards and gadgets can be shared with others and can be included in other web applications using the Actuate JSAPI.
To start building a dashboard, select the new tab icon in the Actuate Information Console.
This will create a dashboard canvas as shown below.
By selecting the down arrow icon on the newly created tab, you can share the dashboard, rename it, set the layout or define data that will be used in the dashboard. Using the Options field will also allow you to set the refresh time for a dashboard. This can be used to present things like live charts or tables. The layout option allows you to define how the dashboard is presented. You can set a columnar option or freeform which allows you to place the gadgets anywhere on the canvas.
The Dashboard and Gadget Gallery menu items contain previously constructed items that have been shared. The New Gadget menu contains the Gadgets that can be placed on the canvas. There are four categories depending on what type of gadget you wish to use: Data Visualization, Data Selection, Report and Extras.
Data Visualization Gadgets
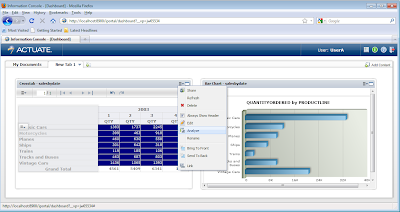
The Data Visualization category contains a set of gadgets that can be used to analyze data. These include a crosstab, a table, and a set of Flash charts.
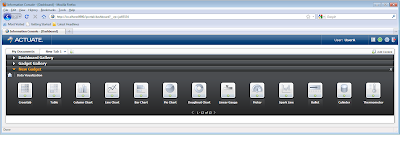
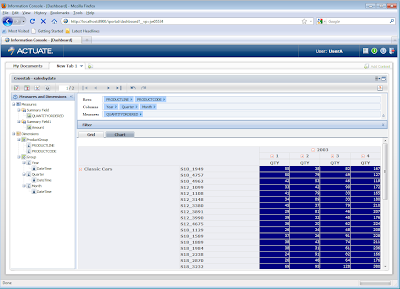
To use one of these gadgets, simply drag it to the canvas below the menu. For example, dragging the crosstab gadget onto the canvas will launch the Crosstab Builder.
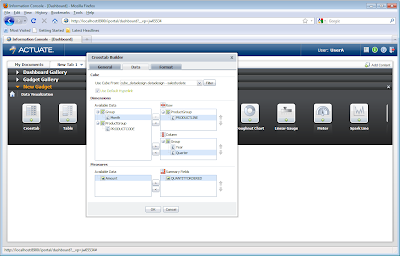
The gadget retrieves its data from a data object or from an on-demand data design. The data design is essentially a set of BIRT data sources, data sets and data cubes. This allows you to leverage existing open source BIRT Reports as content for your dashboard. After assigning the design values for the crosstab you can move the gadget around the canvas to a suitable location.
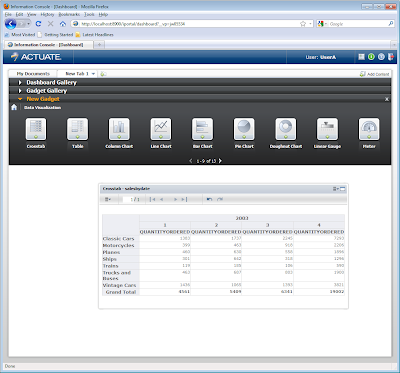
Placing one of the chart types will launch the Chart Builder, which allows specifying the chart data.
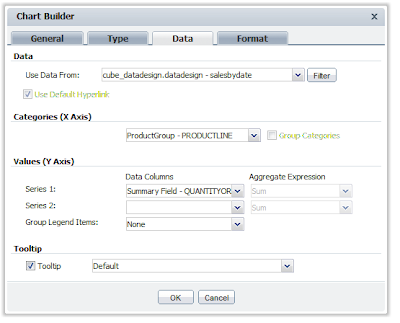
Most data visualization gadgets support further customization for filtering and formatting. In addition the data can be further analyzed by drilling into the data by clicking on actionable fields or by using the Actuate Data Analyzer.
Data Selection Gadgets
The Data Selection category contains a set of gadgets that present selection able data that can be used to drive other gadgets. These gadgets include items like lists, combo boxes and calendar selectors. To use these, just drag the gadget to the canvas and set the data similar to process used for Data Visualization gadgets.
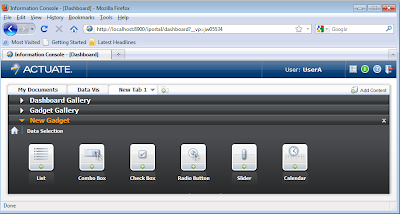
Once the gadget is placed you can link it to another gadget by selecting the target gadget and clicking on down arrow in the upper right corner of the gadget and select link.

This will launch the link editor where you can set field in the target you wish to link on.
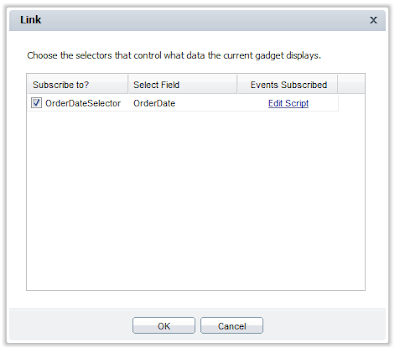
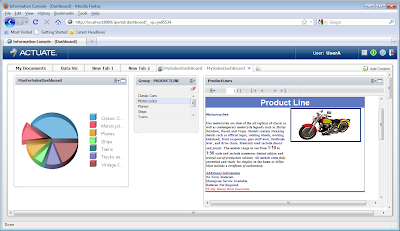
In this particular example the selector updates the report parameter OrderDate for the Report Gadget. Once the linking is complete any time the selector is updated the target gadget will get updated with the new value. Selectors can be linked to multiple gadgets. For example, in the following screenshot, the product line list selector updates an exploded pie chart and a detail report.
Report Gadgets
The Report category contains a set of gadgets that handle presenting BIRT report content. This can include BIRT designs or generated documents, which allows for a cached or on demand design paradigm. In addition the design or document can be further processed to only display a given object in a report or document. Finally a parameter gadget allows the user to use a gadget that displays the parameters for a particular report. This gadget can then be linked to a report gadget, which will be updated when the parameter gadget is changed.

When dragging these gadgets to the canvas a New Report Gadget dialog will be displayed, this allows you to configure the location and parameters for a given report.
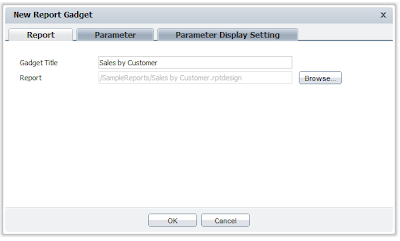
Using the refresh timer on the dashboard will also allow you to update how often the report is updated.
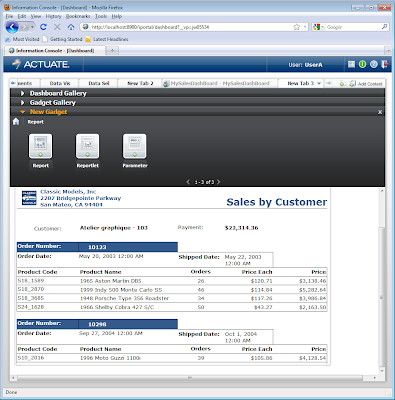
The Reportlet gadget allows the user to define a portion of a BIRT report or document to display. When using these one extra field is available in the New Report Gadget dialog. The field is the Bookmark field and corresponds with bookmark property for the report item in the BIRT report design.
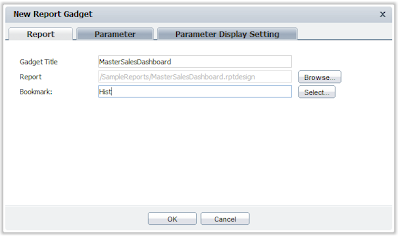
In this example the bookmark Hist is located in the MasterSalesDashboard report design. The Hist bookmark in the BIRT report design corresponds to a grid report item that contains historic sales data.
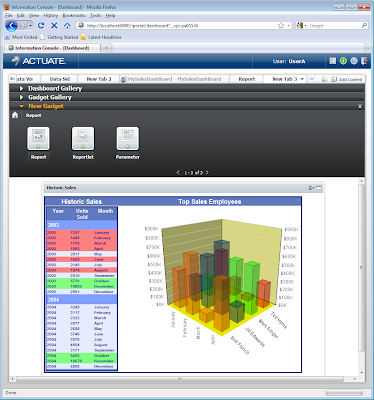
The Parameter gadget functions similarly to the Report and Reportlet gadgets, but only displays the parameter entry dialogs. Once you have a Parameter gadget and a Report gadget on the same canvas you can link them by editing the Report gadget using the down arrow in the upper right corner of the gadget.
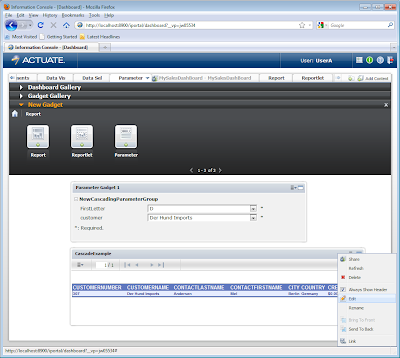
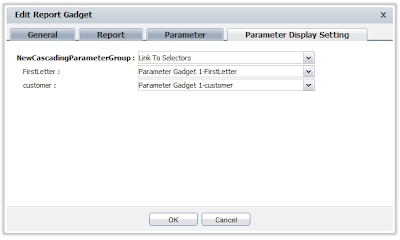
In the Edit Report Gadget dialog choose the Parameter Display Setting tab and in the first drop down select Link to Selectors. For each report parameter use the succeeding drop down menus to link them to the parameter gadget.
Once this is complete updating the parameter in the Parameter gadget will update the report in the Report gadget.
Extras Gadgets
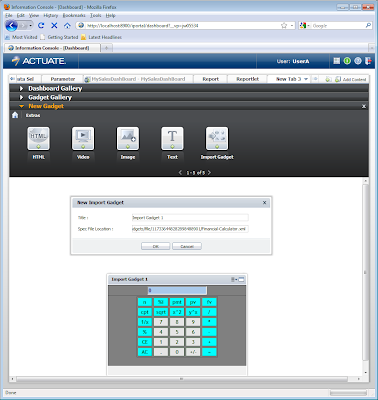
The Extras category contains a set of gadgets that allow you to include images, HTML, customized text, video and Google gadgets in the dashboard.
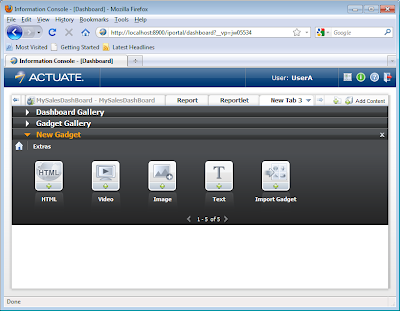
Each gadget will have a custom dialog for configuring the gadget. For example the Import Gadget item dialog allows you to specify the location for a Google Gadget.
Conclusion
This post is an overview of the building BIRT based dashboards using Actuate technology. If you want more details see the help documentation. If you want to try out this functionality download it from BIRT-Exchange.
Posted by
Jason Weathersby
at
7:35 AM
1 comments
![]()