In the example there is a graph that list the Top N customers. This is achieved by setting the filter to use the Top N operator. This is pictured below:
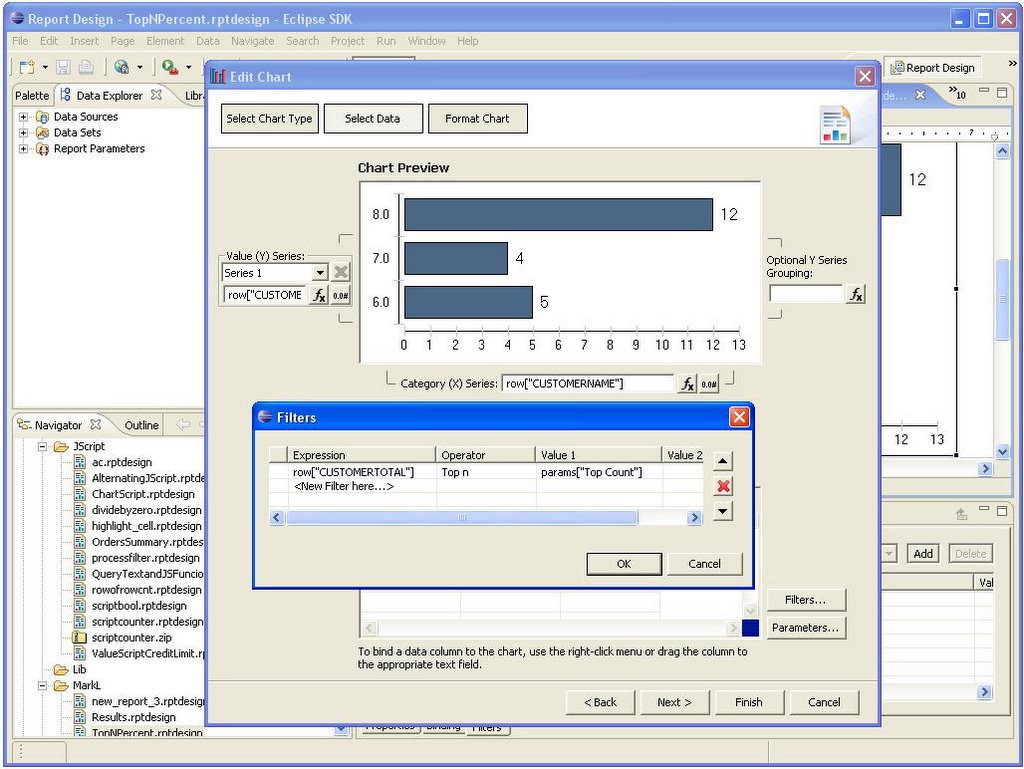
So this graph is taking the Customer Totals and filtering on the Top N, where N is passed in as a parameter to the report.
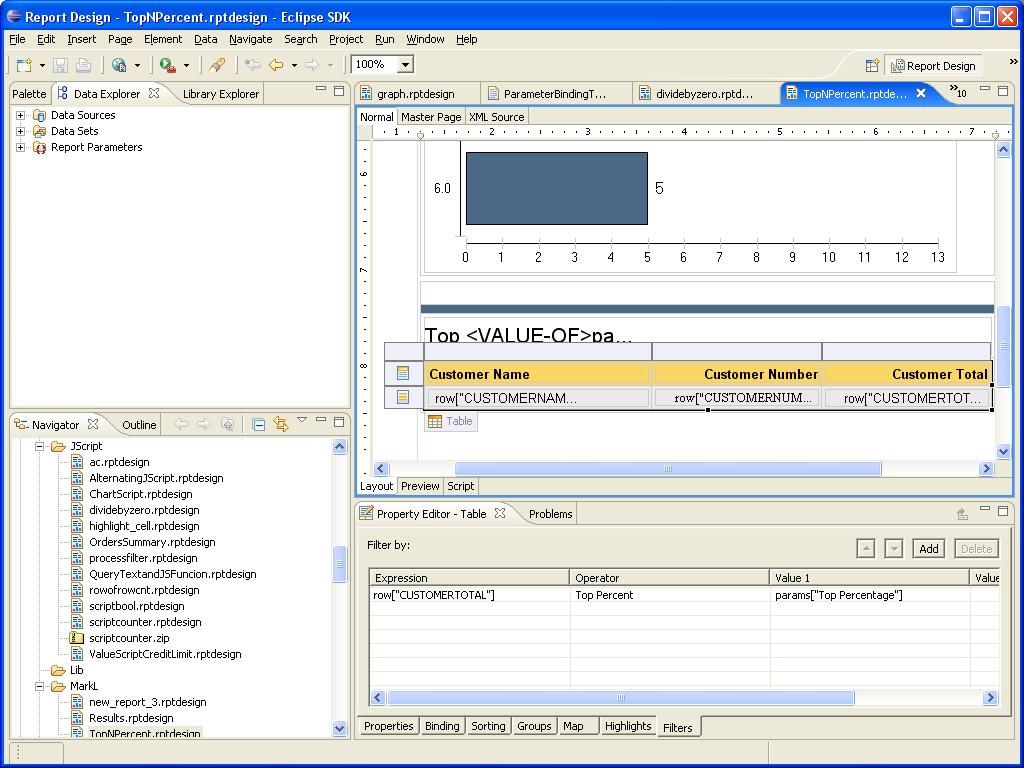
This report also has a table that list the Top M Percent Customers. This is achieved similarly to the graph and is pictured below.
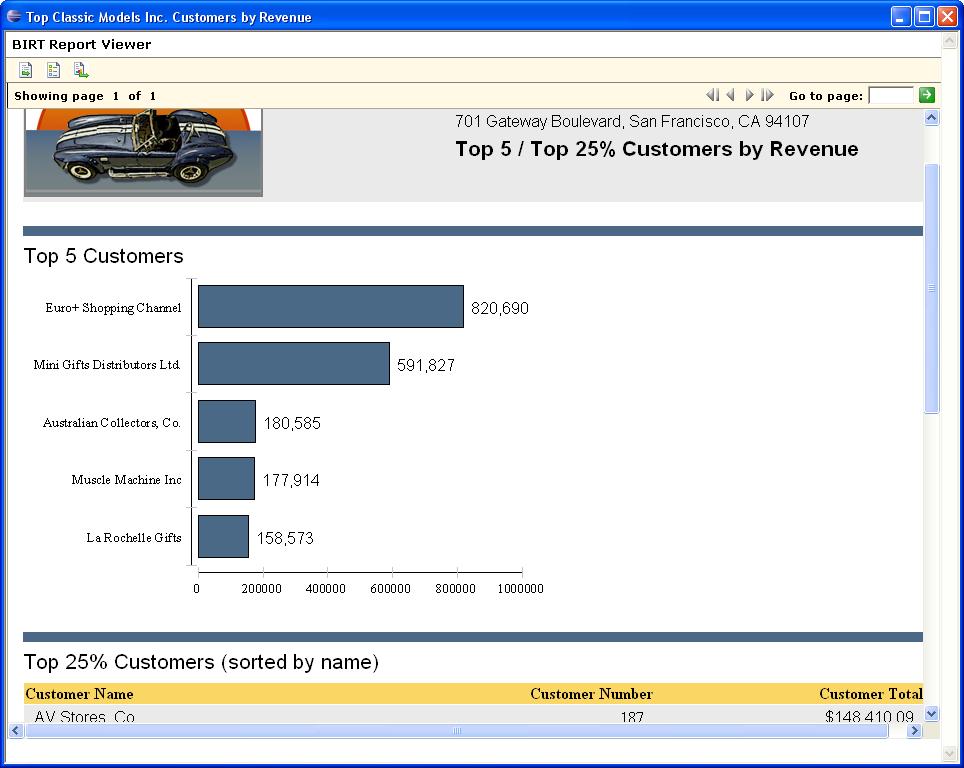
The final report is shown below. You can download the report from the BIRT Website
No comments:
Post a Comment