The BIRT team has released the Project Plan for BIRT 2.0, which will include features like page on-demand navigation, progressive viewing, table of contents support, library usage, external css files, improved scalability,... This list goes on. For the full list of planned features see the Eclipse BIRT site.
Friday, September 30, 2005
Sguil Event reporting with BIRT
John Ward has posted a very good article on Sguil reporting, using BIRT.
You can read about it at The Digital Voice. The article shows quite a few features of BIRT including things like highlighting.
Friday, September 09, 2005
Report Functional Segregation
On the BIRT message board, I was asked, “isn't it better and make much sense to split the rpt design into two pieces:- one that contains all the screen layout details (the actual view part) and another part that contains the actual business logic and the query?”
One of the core designs in BIRT is that the ROM allows report developers to do just that. The breakdown of what goes where may not be what you were expecting, but it does have a logical break out of functionality. One of the key tasks for BIRT developers will be deciding where they should place their unique custom logic to achieve the maximum functionality and reuse.
So how should logic be split up in a BIRT report? Well like many I am still exploring the functionality in BIRT, and I am still waiting to see how the Library functionality is applied in BIRT 2.0. That said, I approach report designs thinking of five key functional areas. The links on the component names will take you to the RomDoc on the BIRT web site which is a valuable resource for understanding what a component can do.
Report Specific Properties (ReportDesign )
Data Acquisition and Preparation (DataSource, DataSet, Row, Parameter)
Report Structure (Grid, Table, TableGroup, Row, Column, )
Report Format (Style, TextData, Text, Image, Rectangle, Label, Line)
Page Presentation (GraphicMasterPage, SimpleMasterPage)
When libraries are enabled in 2.0 this breakdown of functionality will really start to be important. With libraries BIRT developers will be able to create sophisticated report components that can be re-used in multiple report designs.
For example, the DataSource component is responsible for a connection to the outside world that is used to acquire data. A good DataSource component would be able to query the run-time environment, perhaps for a configuration file, to determine what the DataSource should connect to, Dev database in the Dev environment, stageDb in the Stage environment, etc.
In my next few posts, I will attempt to spend a bit more time discussing the various types of components and how they are logically combined and used.
Friday, September 02, 2005
BIRT 1.0.1 Feature Set
Eclipse Business Intelligence and Report Tools (BIRT) Project
Introduction
BIRT is an Eclipse-based open source reporting platform for web applications, especially those based on Java and J2EE. BIRT has two main components: a report designer based on Eclipse, and a runtime component that you can deploy to your application server. BIRT also has a charting engine that lets you include charts in your BIRT reports or add standalone charting capabilities to Java applications.
Report Designer
Application development with BIRT starts with the report designer. This Eclipse-based interface offers an HTML page-oriented design metaphor (similar to Adobe Dreamweaver and other HTML editors) to build reports that are intuitive to create and integrate easily into web applications. Key components include:
- Data Explorer – Manages your data sources (connections) and data sets (queries).
- Layout View – WYSIWYG editor that provides drag and drop creation of the presentation portion of your report.
- Report Item Palette – A palette with a rich set of visual elements such as containers (tables, grids, lists), labels and others.
- Expression Builder – Provides an interface to create calculated fields, format existing ones or perform other data-oriented calculations.
- Style Builder – Creates and manages CSS-like styles for consistent formatting.
- Property Editor – Presents the most commonly used properties in a convenient format that makes editing quick and easy.
- Report Preview – Allows you to test your report at any time with real data.
- Code Editor – Edits custom business logic to be executed during data access, report generation, or viewing.
- Chart Wizard – Defines and formats charts and their accompanying legends and axes.
- Outline – Provides a compact overview of your entire report structure.
- Cheat Sheets – Offer step-by-step instruction on commonly performed tasks to shorten the learning curve.
BIRT provides two flavors of designer: a plug-in for the Eclipse IDE, or a Rich Client Platform (RCP) version that offers a simplified interface without the additional perspectives in the standard Eclipse platform.
Report Design File
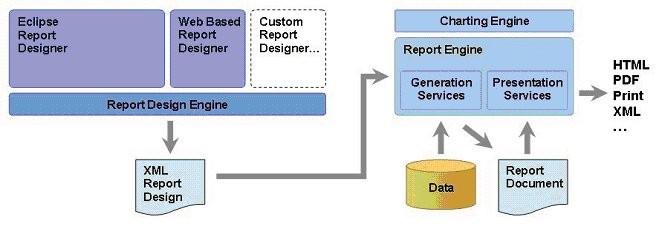
The report design file, as expressed by the BIRT Report Object Model (ROM), is the key design “artifact” associated with a report. It contains the elements that make up a report, including visual design components such as a table or an image and other non-visual items such as report parameters, formatting styles and data sources.
The designer allows the user to define these elements, the design file stores the elements in an XML format adhering to the ROM, and the report engine interprets the elements to produce a report document as output.
Report Engine and the BIRT Viewer
The BIRT report engine API allows you to integrate the run-time part of BIRT into your application as a set of POJOs (Plain Old Java Objects). The engine enables you to discover the parameters defined for a report and get their default values, incorporate included images or charts, retrieve needed data and transform it as necessary and, finally, render the report in HTML or PDF. Report execution also encompasses execution of any custom business logic associated with the report that is written in JavaScript or Java.
Included with the BIRT distribution is a sample BIRT viewer. It is used within the report designer for the preview operation, but can also be used as a simple user interface in your Java application to prompt for report parameters prior to report execution via the report engine API.
Chart Engine
The chart engine provides a rich business chart generation capability to be used standalone or invoked from the report engine. The chart engine supports creation of pie, bar, line, scatter and stock charts, all of which can be rendered in the following graphic formats: 8-bit images, 24-bit images, SWT graphics (GC), SWING graphics (Graphics2D) and SVG.
Design Engine API
The BIRT Design Engine API (DEAPI) enables the programmatic creation or modification of report designs and also provides for interrogation of report elements and semantic checking.
Extensibility
BIRT is more than a reporting tool; it is an extensible reporting framework. As such, it provides a number of extension points to support application-specific and general-purpose modifications. These include:
- The Open Data Access (ODA) framework, which enables the addition of new data sources to BIRT. It provides for both a runtime driver and a design time user interface.
- Custom scripting to incorporate complex and/or application specific business logic into report designs.
- APIs that permit the introduction of new visual components into reports and new attributes for existing components.
- Pluggable architecture for incorporating custom charts and new graphic formats into the charting engine.
Internationalization
BIRT is Unicode enabled, and supports creation of reports in any locale, with the exception of Right-to-Left languages.
Subscribe to:
Posts (Atom)

