Update 07/2010
Details on BIRT Cubes and Crosstabs see this post.
The BIRT PMC Released the draft project plan for BIRT 2.2 last week. A Dynamic Crosstab Report Item is listed as one of the projects. This is an often requested feature and it is great to see that it is slated for the next revision of BIRT. That said, static crosstab reports can certainly be built using the current version of BIRT. Additionally, a fully dynamic crosstab can be built with the help of the Design Engine (DE) API, although the DE API approach requires a little more work and entails building or modifying a report design on the fly.
As background, Wikipedia states that a crosstab displays the joint distribution of two or more variables. In the world of reporting this usually means aggregating left to right and top to bottom.
What is often not stated is that a user is sometimes looking for the number of columns aggregated to be dynamic. We differentiate static crosstabs from dynamic crosstabs based on whether the number of columns in the crosstab is known at design time or at run time.
Krishna Venkatraman, from the BIRT team, supplied an example that is now posted on the BIRT web site that presents a neat static crosstab report. .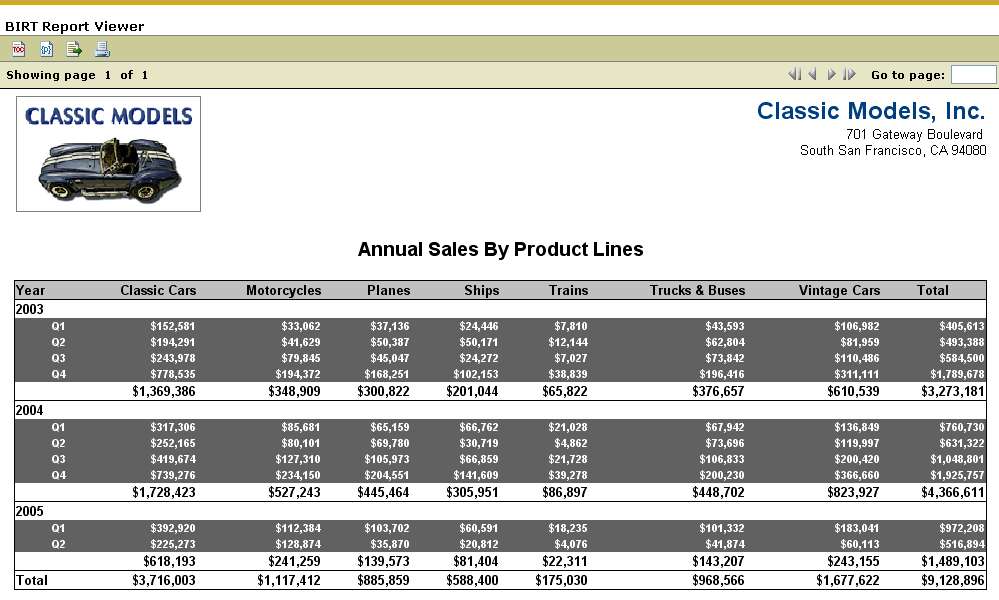
This report sums left to right and top to bottom. Additionally it is grouped by year and quarter. The columns of this report design were known before run time. To do the aggregration Krishna relied on the Total.sum built-in BIRT function. In each column the expression for the field is set to Sum(quantity ordered multiplied by price each). The Total.sum function allows a second parameter that filters what is included in the sum. In this case, the filter is set to the appropriate column.
For example, in the Planes column the expression is as follows:
Total.sum(dataSetRow["AllOrders::OrderDetails::QUANTITYORDERED"]*dataSetRow["AllOrders::OrderDetails::PRICEEACH"],dataSetRow["Products::PRODUCTLINE"]=="Planes").
This filters the values to only include planes within the sum. Additionally the BIRT Binding Editor allows further culling of the data by supplying an Aggregate On field, which allows the data to be aggregated on a group level. If the data element is in the Quarter group, the binding editor is set to only aggregate on the quarter. If the data item is in the Total, it aggregates all group levels.

To build a dynamic crosstab in the current version of BIRT, calls to the Design Engine API (DE API) are required. The DE API can be called from a Java application or built into a servlet. An example on the DE API Examples section of the BIRT Wiki should be a helpful starting point for this endeavor.
The Dynamic Report Servlet example shows how to open an existing report or template and add a table, data source and data set. The number of columns generated is decided at run time and are selected in the dynamic.html webpage.
After selecting the columns the form submit calls the example servlet which executes and displays the modfied report.
Adding column aggregations to create a true crosstab is an relatively simple extension, once you have a good understanding of how the DE API mechanism can be put to work to create dynamic tables.
Thursday, October 12, 2006
Building Crosstabs in BIRT
![]()
Subscribe to:
Post Comments (Atom)


8 comments:
Yet today with Mondrian (OLAP Java tools), and the Birt DE API, it is very easy to build every kind of dynamic crosstabs.
For that matter, your database needs to look like a star data model. For a limited set of data, you can build such a kind of database very easily with an ETL integrated in your report process. To do this, I use an opensource Java tool called Kettle, it works fine and is very fast. My database result is an in-memory database, for example using something like hsqldb. After applying this data transformation, you can build requests using Mondrian and the result can be exploited (in a generic fashion) with the Birt DE API to build crosstabs.
Nicolas Wetzel - Zenika
http://www.zenika.com
OK, this sounds good, but:
One of the reasons why I choose BIRT, is because of the ability to manage parameters for reports.
This strategy for adding dynamic columns doesn't look good to me since I have to write a 'parameter-for-dynamic-columns' GUI widget and place it before the report is executed. So, the GUI gets kind of inconsistent since the first parameter (the one used to determine the dynamic columns) is built 'by hand' and the other parameters (normal ones), are managed by BIRT. The only way to avoid this inconsistence is by writing all parameter related functiolaity again, and thus making BIRT lose the reason why I choosed it (anyway I think there are a lot of other reasons to do that)...
The actual challenge is in finding a way to specify the columns (or any other layout's property) based on the data set of either the report or the parameters or the actual value entered by a user for a specific parameter.
The dynamic crosstab element should be in M6 in a couple of weeks. Have a look,
Jason
http://dev.mysql.com/tech-resources/articles/wizard/
shows a good way of doing crosstables. I used this guide to develop my cross tabs used in birt now.
Nice tutorial. Thanks for posting
Any idea where I can find an ODA plugin for Mondrian? I started working on one but it looks like quite a bit of work and information about how to do this is very sparse.
nobody who say that to connect mondrian and birt is easy has open any piece of code.
so...
I am using BIRT. In my dataset, sometimes my query returns 5 columns, sometimes 6 or more than that i.e basically, my dataset is dynamic. How to prepare a report using dynamic dataSet?
Post a Comment