The BIRT team is looking to better provide information about BIRT to the community and is looking for the feedback in the form of an Eclipse BIRT Awareness survey.
Please take a few minutes to fill this out. Thank you!
Wednesday, November 22, 2006
Eclipse BIRT Awareness survey

Wednesday, November 15, 2006
EclipseCon 2007
EclipseCon 2007 is scheduled for March of this year. The planning for the presentations is well under way. I have been involved in the planning process and have been completely over-whelmed by the quantity and quality of the material that has been suggested for the conference. At this point, the only categories that are formalized are the tutorial tracks.
Tutorials will be offered on the first day of the conference. They are divided into two categories, short tutorials are a two hour in-depth look at a particular subject. The long tutorials are full day presentations with a 'hands-on' component. For those of you who do not like conferences because they do not go into enough details, you should consider the EclipseCon tutorials. Looking at the submissions, we have had:
- 18 long tutorial proposals for 7 slots
- 63 short tutorial presentations for 39 slots
In terms of BIRT and the reporting project, there are five tutorial presentations that may be of interest:
The BIRT Long Tutorial is a full day demo/lab on how to work with the BIRT report development environment.
The short tutorials include are all focused on in-depth BIRT topics to either extend or integrate BIRT into web or stand-alone applicatons.
Eclipse Chart Engine API and Integration
Report Integration - The BIRT API's
Open Data Access - Extension framework for adding Custom Data Sources
Get Involved - Short and Long Talks
The EclipseCon committee will now be turning our attention on the content for the Long Talks (one hour) and Short Talks (10 minutes). The BIRT team has been given 5 long talk slots and 6 short talk slots. I would love to see talk proposals from our user community for both the long and short talks. If you are using BIRT and would like to share your experience, please submit a talk HERE.
Friday, October 20, 2006
Aggregate Update
When I did the Aggregate example, I noticed that I could not import the DataTypeUtil from the org.eclipse.birt.data project. To work around this, I just created my own DataTypeUtil class. I hate this kind of code, so I submitted a bug to have those class(s) exposed. It turns out that the issue is the way in which I was adding the dependency classes.
DataTypeUtil is in the org.eclipse.birt.data project, so this item needs to be added to your dependencies. In addition, DataTypeUtil throws a BirtException. So you need to add the org.eclipse.birt.core package.
But there is a catch. The org.eclipse.birt.core package has a filter that acts to block the inclusion of items from the org.eclipse.birt.data project. So it can not be the last item in the dependency list. I have asked the developers to look and see if they can resolve this issue.
Scott
Thursday, October 12, 2006
Building Crosstabs in BIRT
Update 07/2010
Details on BIRT Cubes and Crosstabs see this post.
The BIRT PMC Released the draft project plan for BIRT 2.2 last week. A Dynamic Crosstab Report Item is listed as one of the projects. This is an often requested feature and it is great to see that it is slated for the next revision of BIRT. That said, static crosstab reports can certainly be built using the current version of BIRT. Additionally, a fully dynamic crosstab can be built with the help of the Design Engine (DE) API, although the DE API approach requires a little more work and entails building or modifying a report design on the fly.
As background, Wikipedia states that a crosstab displays the joint distribution of two or more variables. In the world of reporting this usually means aggregating left to right and top to bottom.
What is often not stated is that a user is sometimes looking for the number of columns aggregated to be dynamic. We differentiate static crosstabs from dynamic crosstabs based on whether the number of columns in the crosstab is known at design time or at run time.
Krishna Venkatraman, from the BIRT team, supplied an example that is now posted on the BIRT web site that presents a neat static crosstab report. .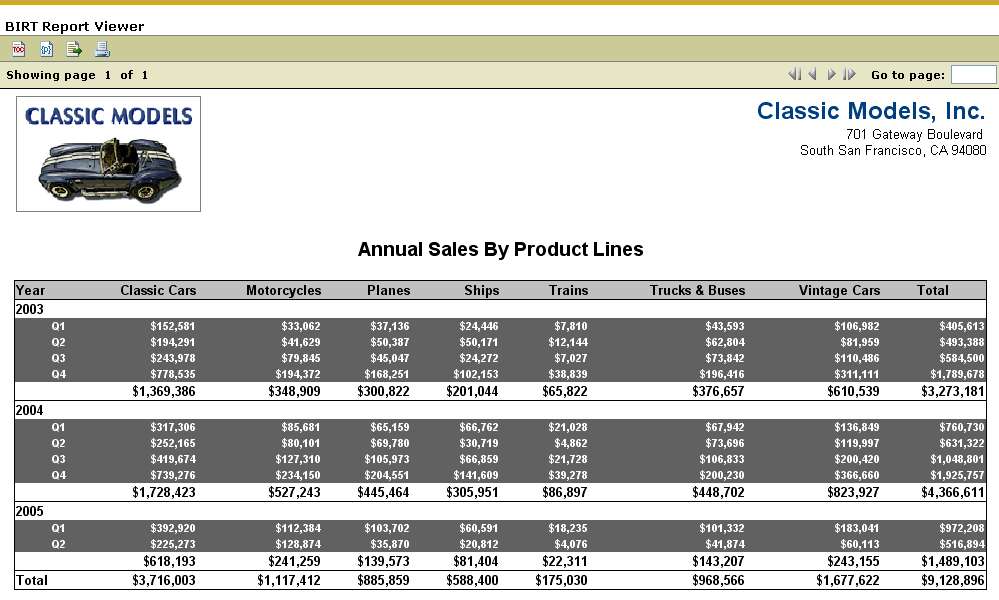
This report sums left to right and top to bottom. Additionally it is grouped by year and quarter. The columns of this report design were known before run time. To do the aggregration Krishna relied on the Total.sum built-in BIRT function. In each column the expression for the field is set to Sum(quantity ordered multiplied by price each). The Total.sum function allows a second parameter that filters what is included in the sum. In this case, the filter is set to the appropriate column.
For example, in the Planes column the expression is as follows:
Total.sum(dataSetRow["AllOrders::OrderDetails::QUANTITYORDERED"]*dataSetRow["AllOrders::OrderDetails::PRICEEACH"],dataSetRow["Products::PRODUCTLINE"]=="Planes").
This filters the values to only include planes within the sum. Additionally the BIRT Binding Editor allows further culling of the data by supplying an Aggregate On field, which allows the data to be aggregated on a group level. If the data element is in the Quarter group, the binding editor is set to only aggregate on the quarter. If the data item is in the Total, it aggregates all group levels.

To build a dynamic crosstab in the current version of BIRT, calls to the Design Engine API (DE API) are required. The DE API can be called from a Java application or built into a servlet. An example on the DE API Examples section of the BIRT Wiki should be a helpful starting point for this endeavor.
The Dynamic Report Servlet example shows how to open an existing report or template and add a table, data source and data set. The number of columns generated is decided at run time and are selected in the dynamic.html webpage.
After selecting the columns the form submit calls the example servlet which executes and displays the modfied report.
Adding column aggregations to create a true crosstab is an relatively simple extension, once you have a good understanding of how the DE API mechanism can be put to work to create dynamic tables.
Monday, October 02, 2006
BIRT Preferences
Report Design
As a developer, I look at my innate laziness as a virtue, I always try to automate the simple tasks. The BIRT report designer allows you to automate several of the routine development tasks through the preferences tab. I am just going to run the various preference options to illustrate what is available.The options for BIRT Reports can be found under Window => Preferences => Report Design. You can quickly see that there are several sub - dialogs under Report design.

The first sub dialog is to set up preferences for charting, logically entitled Chart. You have to options here. The first thing to note is that for the Chart, preview refers to the view of the chart within the chart editor. As you work with the chart editor, selecting data sets and fields, the chart editor by default will show data from the actual query, using up to 6 rows of data. When the report actually runs, in the Preview tab, these settings are ignored.
If you do not want to run the query to the data when you are in the chart editor, or if you would like to adjust the number of data rows used to create th e preview image in the chart editor, adjust this dialog appropriately.
Comment Template
I always like to leave a comment block on any code that I write identifying who created the code, when it was created, etc. Every now and then someone doing maintenance on code that I created will contact me with questions on something I have written. Unfortunately, in the rush to get things done, it is way too easy to forget this step.Fortunately, I can just set up my workspace to add the comments automatically. One less repetitive task to take care of.

Data Set Editor
The BIRT Data Set Editor dialog controls the behavior of all BIRT Data Set Editors. The first dialog controls the number of rows displayed in the preview dialog of the data set editor. This property is ignored when you a view a report using the Report Preview Tab.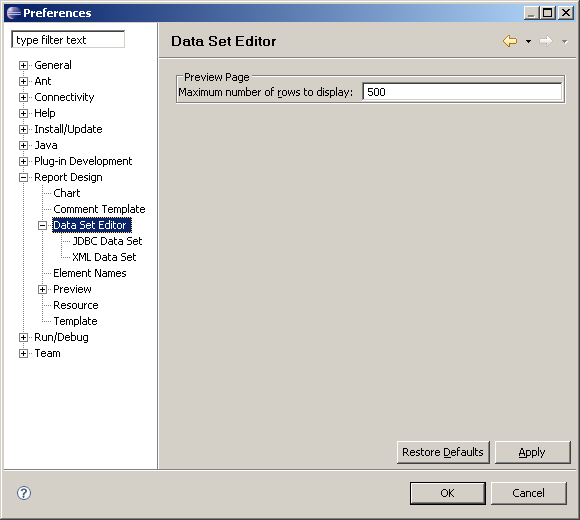
JDBC Data Set
The JDBC Data Set dialog queries the database server looking at the schemas, and the tables within each schema. This information is used to populate the Available Items and Schema fields of the JDBC DataSet dialog. In some cases, this query can be a very expensive and time consuming activity. The Report Design => Data Set Editor => JDBC Data Set allows you to control the amount of database meta data that the Report Designer will query.
If you lower the limits on these items, the table or schema that you would like to query may not show up in the Available Items area, or schema drop-downs. The unshown items are still available, but the developer will need to know the actual names and will have to write (or copy) the appropriate sql query.
XML Data Set
The XML Data Set will only pull in a limited number of rows from an XML data source.


Element Names
You can create custom name patterns for your BIRT elements. This is particularly useful if you plan on writing BIRT Script and you want to control the names of the controls. This topic was all ready covered in this post.
Preview
Okay this is the third time that I talk about Preview, and now I am actually going to talk about the preview that occurs when you run and view a report. The first interesting feature is for those report developers that will be deploying into multi-lingual environments. Through the locale drop-down, you can control which locale your report will use when it runs, without modifying the machine locale settings.The next check boxes control the report behavior when running in an external browser. Simply click on the Preview tab in the Report Perspective, brings up the standard built in report browser. When you run the report in a browser (through the File menu or the View Report icon) you will either use your default browser, or the browser of your choice.
The Maximum number of rows to display option works on both the Preview tab and when you View Report as HTML (File menu or Icon). Essentially, this allows you to see a section of a slow running report much quicker. This option does not impact a report when run in the Web Viewer or when run through the Report Engine.

Preview Server
Eclipse ships with a Tomcat web application server. This app server is used to server up the Eclipse help files. In addition, BIRT uses the web server to display reports in preview mode. By setting the server and port values in this dialog, you can allow other users to use the Tomcat server running under your Eclipse instance to preview report designs you have created. I have included the URL that you would use assuming that your server name is my_server and the port you want to use is 9999.
http://my_server:9999/viewer/frameset?
__report=c:\workspace\work_birt_sdk\my_reports\quick.rptdesign
&__format=html
&__svg=false
&__locale=en_
&__designer=true
&__masterpage=true
&__rtl=false
&__maxrows=500
&__resourceFolder=C:\Program+Files\Actuate\BRDPro\resources&-49158193

Resource
There are two basic types of resource files. Image files and localization properties files. These types of files are often shared between developers. Setting the Report Design => Resource => Resource folder allows developers to locate these shared files in a common network repository.
Template
Templates allow developers to simplify repetitive report design tasks. Typical team development environments will want to be able to create and share report templates. By default, templates are stored in the following directory:$ECLIPSE_HOME/plugins/org.eclipse.birt.report.designer.ui_version/templates
Modifying the report => templates location allows developers to share report templates from a common network location.
Tuesday, September 26, 2006
Optimistic Sums
Suppose you are developing reports for the Sales team. Your reports are providing insight into the sales channel. Your reports aggregate the sales estimates rolling the estimates up to the executive vice president of sales. The management team wants to see a bit more optimistic view of the sales forecasts. They ask you, "is there any way that you can manipulate the reports to provide a more optimistic view of the sales estimates."
Now my initial reaction would be one of alarm, "you want me to do what?" But then my curiosity would get a hold of me, is there a good way to do this? What is the best way?
First, you could create custom Birt Script sprinkled through out your reports that would round up the numbers as they are imported. Second, you could manipulate the data in the database either when you query it, or in the raw data. Third, you could create custom java functions to that you would integrate into your BIRT script. Fourth, you could make a Bugzilla entry and ask the BIRT team to add the new function.
Yes, there are a lot of ways that you could solve this problem, but there are issues with each method. None of them provide a really seamless way to customize your implementation of BIRT. Fortunately, BIRT ships with a standard way to add new aggregate functions to the basic BIRT Total functions. It is all done through the org.eclipse.birt.data.aggregation extension point. This post will walk you through the process of using the aggregation extension point to create your own OptimisticSum function and add it to your BIRT implementation.
The entire Eclipse Platform is built through a common extendable framework. In short Eclipse is made of a large number of plug-ins. Each plug-in can provide the ability to customize or extend its behavior through an extension point. When you create an implementation of an extension point, you are creating an extension. So BIRT is made up all of the BIRT plug-ins. Each BIRT plug-in has defined extension points where you can define new BIRT functions. What we are going to do is extend the org.eclipse.birt.data.aggregation extension point.
If you are interested in Eclipse extensions, there are a number of resources that you can use. In the standard Eclipse help, there are three guides that you may find useful: Platform Plug-in Developer Guide, JDT Plug-in Developer Guide, and the Plug-in Development Environment Guide all provide great information on plug-in development. In addition, "The Java Developer's Guide to Eclipse" provides a complete overview of the entire Eclipse plug-in development process.
Fortunately, you don't need to know that much to do a simple BIRT aggregate extension. I have created an eleven minute screen-cast that walks you through the entire process of creating a BIRT aggregate extension. You can find it here.
I also have a plug-in project that demonstrates the OptimisticSum control available here.
Here is an outline of the high level steps that are required to create a BIRT data aggregate extension:
1) Create a plug-in project
2) Add a dependency on the org.eclipse.birt.data plugin
3) Create an extension of the org.eclipse.birt.data.aggregation extension point
4) Configure the plugin.xml, here is a sample
<extension id="com.innoventsolutions.aggregate" name="TotalPlus" point="org.eclipse.birt.data.aggregation">
<aggregations>
<Aggregation aggregationClass="com.innoventsolutions.aggregate.OptimisticSum"
name="OptimisticSum">
<UIInfo parameterMetaInfo="String a, String b, String c" textData="Total.OptimisticSum()" tip="New Optimistic Sum tip~"/>
</aggregation>
</aggregations>
</extension>
5) Create an aggregationClass which either extends:
org.eclipse.birt.data.engine.api.aggregation.Aggregation
or implement the following interface:
org.eclipse.birt.data.engine.api.aggregation.IAggregation
If you are creating a single pass aggregate (one trip through the data) just extend the Aggregation class. If you need to do multiple passes over the data use implement the IAggregation interface.
6) In your aggregationClass implement the following methods
getName = name of the function
getType = 0 for Summary function, or 1 for Running function
getParameterDefn = is a boolean array, set to true for each required parameter.
newAccumulator = instantiate an instance of an Accumulator (see next step)
7) Create an extension of the
org.eclipse.birt.data.engine.api.aggregation.Accumulator
8) Implement the following methods in your Accumulator
getValue = returns the value that you have been accumulating
onRow = receives an array of parameters that you use to fulfill your function. For each row of data returned by your DataStream, the onRow event will be called one time.
9) Test / Debug your new plugin by running the project as an Eclipse Application. This will open a new instance of Eclipse. This new 'Runtime' instance of Eclipse will allow you to open up report designs and test your code. If you use the Debug Eclipse Application option when you test your plugin project, you will be able to step through your code, just like in standard Java development with Eclipse.
10) When you have completed your testing you can create a plugin jar by using the export feature on the project and export your project as a Plug-in Development => Deployable Plug-ins and fragments options to create a jar file. Simply dropping that jar file into the plugins directory of your BIRT deployment, and you custom function will be available.
Good luck creating your own BIRT Functions.
Scott
Tuesday, August 29, 2006
Building a Combination Chart with BIRT
A new screen cast has been added to the BIRT web site that demonstrates building a Combination Chart. This example uses a bar chart with a line chart superimposed. It also illustrates how drill to details can be implemented within a chart.
It can be viewed here.
Additionally the Charting FAQ is now available in the Eclipse Wiki.
The Charting FAQ explains many details on how the Charting Engine can be deployed, customized and manipulated.
Subscribe to:
Posts (Atom)


